Resonant Ultrasound Spectroscopy
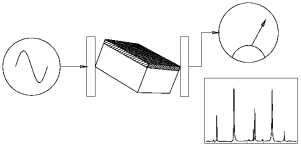 Figure1: Schematic of a RUS sample composed of a substrate (white) and film (hatched) sandwiched betweentransducers. The inset shows and actual measured spectrum. |
Resonant Ultrasound Spectroscopy (RUS) is an elegant method of measuring the complete elastic tensor of a material. The scheme utilizes the fact that the mechanical vibration resonance spectrum depends on the geometry, mass density, and elastic tensor of the sample. Samples (generally parallelepipeds) are polished to a mirror finish on all six sides, and accurate dimensions are obtained. The sample is them lightly sandwiched between transducers so that a resonance spectrum can be obtained (see Figs. 1 and 2). The spectrum (center frequencies of the resonance peaks) is then used as input data for a program which adjusts the initially guessed elastic tensor until the calculated spectrum most closely matches the measured spectrum. Thus one must have a reliable method of computing the spectrum of a 3D elastic solid. |
This is accomplished by using the Rayleigh-Ritz method in which an expansion form for the eigenvectors is assumed and coefficients are adjusted until the Lagrangian is minimized. RUS became a viable experimental method in the early 1990's when desktop computers became powerful enough to accomplish the task in a reasonable time and a new expansion basis was devised by Visscher, et. al. at Los Alamos. The so-called Visscher basis set allowed for reliable computation of eigenvalues (resonant frequencies) for a wide variety of geometries, even including a "potato" defined by ellipsoidal cross-sections!
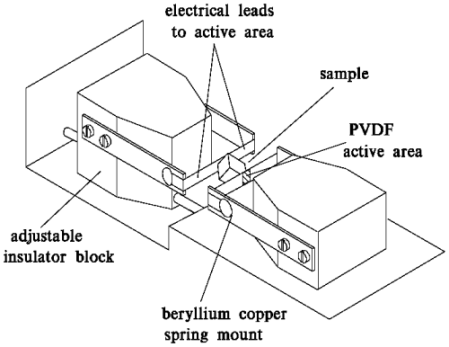 Figure 2: A more detailed view of the RUS cell devised by Jay Maynard of Penn State University. |
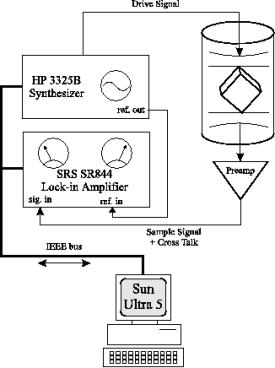 Figure 3a: Schematic of a typical RUS experiment. Typical drive amplitudes are 10 V peak-to-peak. |
The procedure for thin film samples is similar to homogeneous bulk crystal methods with some additional steps. First, the substrate must be well characterized, so a standard RUS experiment is performed to get the optimized set of substrate parameters (dimensions and elastic constants). Next the film is deposited and the sample is remeasured. The resonance peaks will have shifted slightly due to the presence of the film. The new spectrum is then analyzed using version of the RUS software which takes into account the presence of the film. The substrate elastic constants are held fixed at their optimized values and the film elastic constants are allowed to vary. For a high quality factor substrate (Q>1,000), frequency shifts as small as 10 ppm can be measured. This level of precision makes thin film RUS ideally suited for probing phase transitions in thin films. The sample response signal is converted to a DC signal by the high frequency lock-in amplifier.
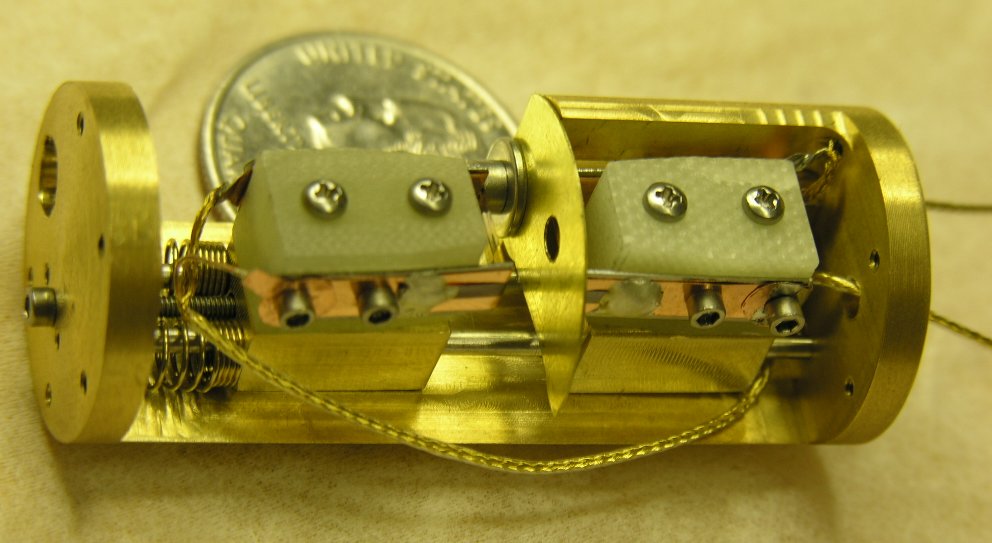 Figure 3: Recently completed small sample RUS cell at the University of Mississippi. |
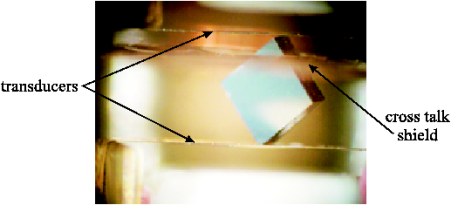 Figure 4: Photo through a microscope of a mounted strontium titanate substrate with a ~500 nm aluminum film. The longest dimension of the sample is about 700 microns. |
The RUS computer code produces the optimized set of eigenvalues, used to determine the resonance spectrum, but also determines the eigenvectors which can be used to visualize the displacement of the sample surface from it's equilibrium shape. The normal modes for a parallelepiped are shown in Fig. 5, and a tube are shown in Fig. 6. The links below each will display and animation of the object in resonance for the selected modes. Note that the amplitudes of displacement are drastically amplified to aid in visualization. The red regions indicate nodal regions and yellow indicates anti-nodal regions, and the modes are listed in order of increasing frequency.
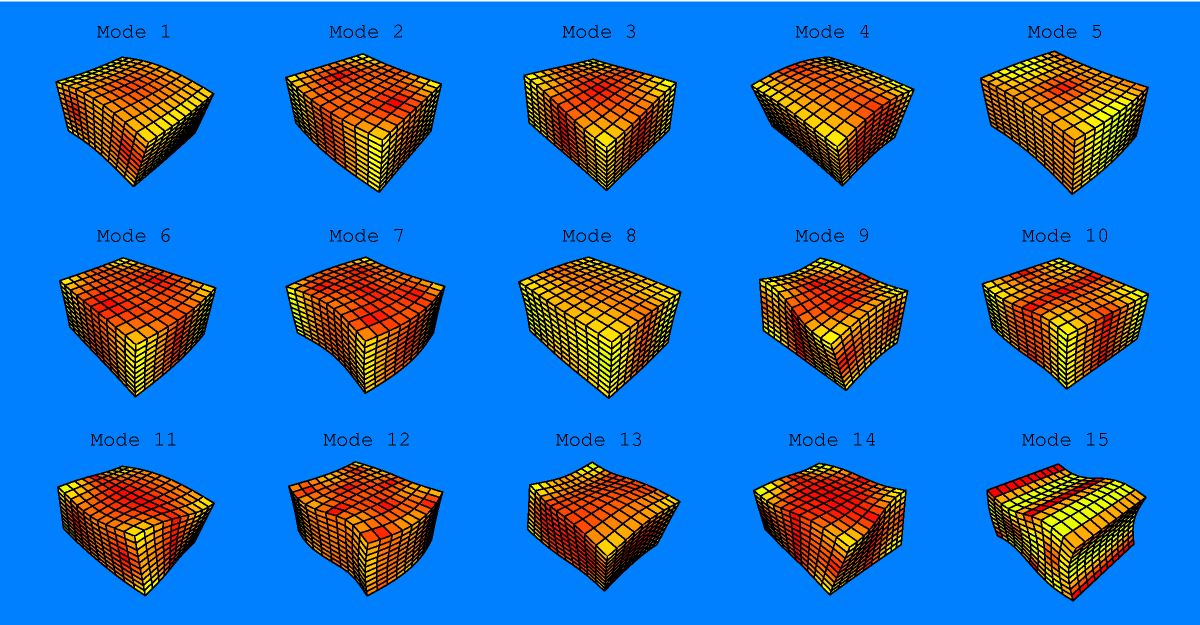
Figure 5: Vibrational Normal modes for a Parallelepiped
View animations of: mode 5, mode 9, mode 12, mode 15
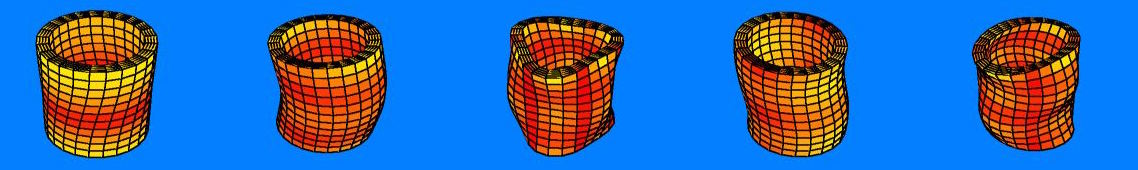
Figure 6: Vibrational Normal modes for a Cylindrical Shell
View animations of: mode 1, mode 5, mode 14, mode 23
Some links to information on RUS:
- Jay Maynard, Penn State Dept. of Physics
- Dynamic Resonance Systems: maker of a commercial RUS system.
- Albert Migliori, Los Alamos National Lab
- Veerle Keppens: University of
Tennessee, Knoxville Dept. of Materials Engineering