PHOTOELECTRIC EFFECT
In this experiment we measure Plank's constant h and the work function of an unknown metal.
Introduction
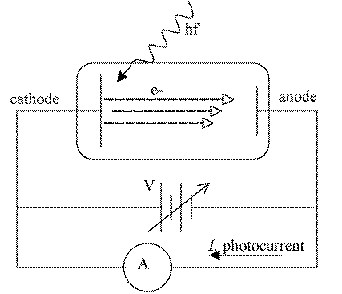
When light of frequency f illuminates a metal
plate electrons are released from the cathode by the
photoelectric effect. A photocurrent I is observed,
indicating the flow of photoelectrons to the anode
and back to cathode through the circuit.
The kinetic energy of the electrons is given by KE = hf - BE (1)
hf = photon energy
BE= electron binding energy in the metals energy band.
If a retarding voltage V
is slowly applied to the anode, only the most energetic electrons
will reach,
When the photocurrent I
reaches zero (s=stopped)
and V = Vs we can write
KEmax = e Vs = hf - W (2)
W = minimum binding energy of the
electron = work function of the metal
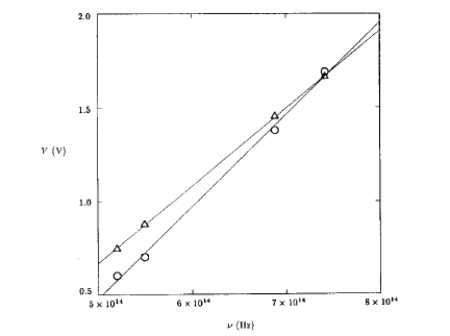
Rearranging eq (2) and plotting Vs
= (h/e)f -W/e
as y=mx
+ b we can deterine Planck's constant h
and the materials work function W.
slope
= h/e (3)
intercept = W/e (4)
Procedure
(1) Turn the Hg lamp on and let it warm up for 15 minutes before taking any data. .
(2) Do not stare in to the Hg source, the UV can be harmful to your eyes.
(3) Cover the PE tube opening so no light enters.
(4) Turn the PE apparatus on, turn the picoammeter on, turn the DVM(retarding voltage) on.
Let these devises come to temperature equilibrium.
(5) Move
the Hg lamp in to place (if not already positioned) over the opening
in the metal
box holding the PE tube. Keep the geometry fixed during the
measurements. This could be a source
of systematic error.
(6) Record the PE cirrrent with lamp covered. This indicates your zero reading.
| PE Current w no light = |
(8) Uncover the tube and insert the Blue
(410nm), Green(536nm), and Red(460nm) filters. For
each filter zero the
photocurrent by adjusting the retarding voltage V and
record your values for Vstop.
| blue | green | red | |
| wavelength | 405 nm | 536 nm | 610 nm |
| frequency | |||
| Vstop |
(9) For the red llght msource use either
the He-Ne laser or laser diode and the right-angle prism
to direct light in to the PE tube. Then find the stopping voltage
Vs.
ANALYZE YOUR DATA
(1) Plot Vs vs f on graphing program which allows you to do linear fitting. KaleidaGraph, CricketGraph, Excel
(2) Fit the three points with a linear fit and record the slope and intercept.
| Slope | Err_Slope | Intercept | Err_intercept |
From equations (3) NAD (4) Determine
Planck's constant and the work function of the
material
supplying the correct units.
| h | Err_h | W | Err_W |
(3) From the value of your work function try to determine the photocathode material? Check on the web!
(4) Discuss statistical and systematic errors in your lab report.